LLM Tracing
Tracing your LLM application helps you monitor its full execution from start to finish. With deepeval's @observe decorator, you can trace and evaluate any LLM interaction at any point in your app no matter how complex they may be.
Quick Summary
An LLM trace is made up of multiple individual spans. A span is a flexible, user-defined scope for evaluation or debugging. A full trace of your application contains one or more spans.
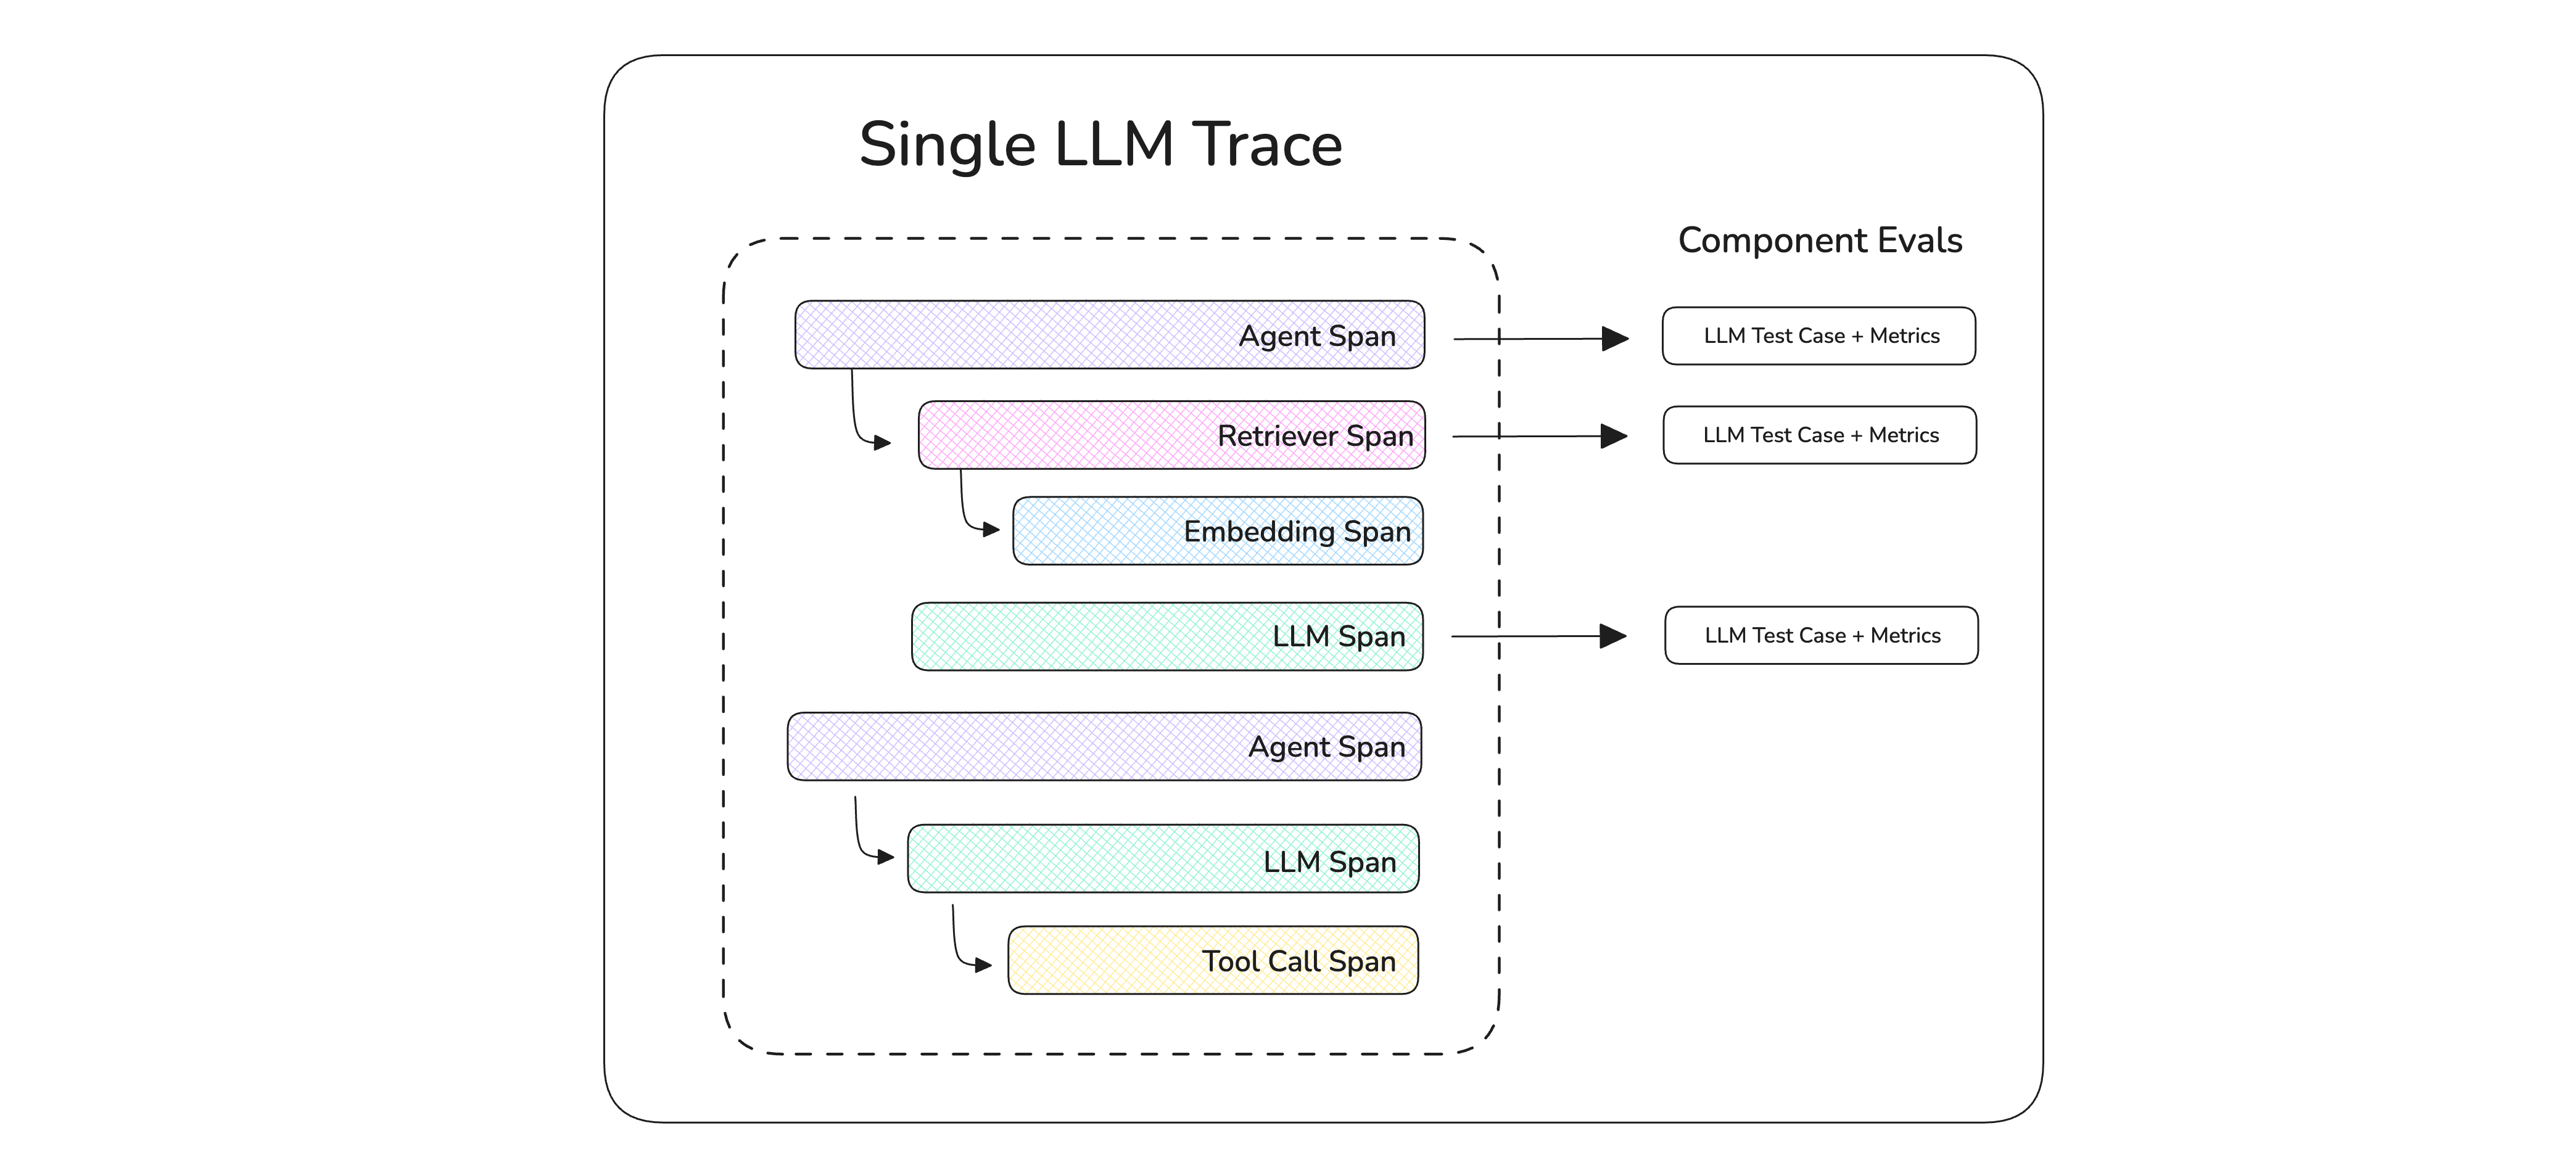
The most important thing to understand is how traces and spans map to evaluation in deepeval:
- A trace is the
LLMTestCasefor end-to-end evals — itsinput,actual_output,retrieval_context,tools_called, andexpected_outputdescribe the whole run of your LLM app. - A span is the
LLMTestCasefor component-level evals — the same parameters apply, but they describe what happened inside that one component (a retriever, a tool, an LLM call, an agent step).
This means you don't need a separate concept to evaluate traces. The primitives (LLMTestCase, metrics, goldens) you already use for unit-style evals all work on traces and spans too — you just attach them via update_current_trace and update_current_span.
Learn how deepeval's tracing is non-intrusive
deepeval's tracing is non-intrusive, it requires minimal code changes and doesn't add latency to your LLM application. It also:
-
Uses concepts you already know: Tracing a component in your LLM app takes on average 3 lines of code, which uses the same
LLMTestCases and metrics that you're already familiar with. -
Does not affect production code: If you're worried that tracing will affect your LLM calls in production, it won't. This is because the
@observedecorators that you add for tracing is only invoked if called explicitly during evaluation. -
Non-opinionated:
deepevaldoes not care what you consider a "component" - in fact a component can be anything, at any scope, as long as you're able to set yourLLMTestCasewithin that scope for evaluation.
Tracing only runs when you want it to run, and takes 3 lines of code:
from deepeval.metrics import AnswerRelevancyMetric
from deepeval.tracing import observe, update_current_span
from openai import OpenAI

client = OpenAI()

@observe(metrics=[AnswerRelevancyMetric()])
def get_res(query: str):
    response = client.chat.completions.create(
        model="gpt-4o",
        messages=[{"role": "user", "content": query}]
    ).choices[0].message.content

    update_current_span(input=query, output=response)
    return response
Why Tracing?
Tracing turns the local eval loop — run the agent, inspect the trace, identify the failing span, patch the prompt or code, run the eval again — into something both you and a coding agent can drive without any context switch:
Concretely, tracing your LLM application lets you:
-
Generate test cases dynamically: Many components rely on upstream outputs. Tracing lets you define
LLMTestCases at runtime as data flows through the system. -
Debug with precision: See exactly where and why things fail — whether it's tool calls, intermediate outputs, or context retrieval steps.
-
Run targeted metrics on specific components: Attach
LLMTestCases to agents, tools, retrievers, or LLMs and apply metrics like answer relevancy or context precision — without needing to restructure your app. -
Run end-to-end evals with trace data: Use the
evals_iteratorwithmetricsto perform comprehensive evaluations using your traces.
Setup Your First Trace
To set up tracing in your LLM app, you need to understand two key concepts:
- Trace: The full execution of your app, made up of one or more spans.
- Span: A specific component or unit of work—like an LLM call, tool invocation, or document retrieval.
You should login to see traces for free on Confident AI:
deepeval loginFinally, pick how you want to instrument your app. deepeval also offers first-class integrations for popular agent frameworks where deepeval produces traces with zero or one line of setup.
Wrap any function in your LLM app with @observe — each call becomes a span, and the outermost call becomes the trace. Spans nest naturally as @observe'd functions call each other.
from openai import OpenAI
from deepeval.tracing import observe

@observe()
def retriever(query: str) -> list[str]:
    # Your retrieval logic
    return [f"Context for the given {query}"]

@observe()
def llm_app(query: str) -> str:
    context = retriever(query)
    return OpenAI().chat.completions.create(
        model="gpt-4o",
        messages=[{"role": "user", "content": f"{query}\n\n{context}"}],
    ).choices[0].message.content

llm_app("Who founded DeepEval?")
@observe accepts a few optional parameters:
- [Optional]
metrics: a list ofBaseMetrics to attach for component-level evals. - [Optional]
name: how this span is displayed in the trace tree (defaults to the function name). - [Optional]
type: classifies the span — see Classify spans by type. - [Optional]
metric_collection: name of a metric collection you stored on Confident AI.
Build your agent with create_agent and pass deepeval's CallbackHandler to its invoke method.
from langchain.agents import create_agent
from deepeval.integrations.langchain import CallbackHandler

def multiply(a: int, b: int) -> int:
    """Multiply two numbers."""
    return a * b

agent = create_agent(
    model="openai:gpt-4o-mini",
    tools=[multiply],
    system_prompt="Be concise.",
)

agent.invoke(
    {"messages": [{"role": "user", "content": "What is 3 * 12?"}]},
    config={"callbacks": [CallbackHandler()]},
)
See the LangChain integration for the full surface.
Wire your StateGraph (LangGraph's core abstraction) and pass deepeval's CallbackHandler to its invoke method.
from langchain.chat_models import init_chat_model
from langgraph.graph import StateGraph, MessagesState, START, END
from deepeval.integrations.langchain import CallbackHandler

llm = init_chat_model("openai:gpt-4o-mini")

def chatbot(state: MessagesState):
    return {"messages": [llm.invoke(state["messages"])]}

graph = (
    StateGraph(MessagesState)
    .add_node(chatbot)
    .add_edge(START, "chatbot")
    .add_edge("chatbot", END)
    .compile()
)

graph.invoke(
    {"messages": [{"role": "user", "content": "What is 3 * 12?"}]},
    config={"callbacks": [CallbackHandler()]},
)
See the LangGraph integration for the full surface.
Drop-in replace from openai import OpenAI with from deepeval.openai import OpenAI. Every chat.completions.create(...), chat.completions.parse(...), and responses.create(...) call becomes an LLM span automatically.
from deepeval.openai import OpenAI

client = OpenAI()
client.chat.completions.create(
    model="gpt-4o",
    messages=[{"role": "user", "content": "Hello"}],
)
See the OpenAI integration for the full surface (including async, streaming, and tool-calling).
Pass DeepEvalInstrumentationSettings() to your Agent's instrument keyword.
from pydantic_ai import Agent
from deepeval.integrations.pydantic_ai import DeepEvalInstrumentationSettings

agent = Agent(
    "openai:gpt-4.1",
    system_prompt="Be concise.",
    instrument=DeepEvalInstrumentationSettings(),
)

agent.run_sync("Greetings, AI Agent.")
See the Pydantic AI integration for the full surface.
Call instrument_agentcore() before creating your AgentCore app. The same call also instruments Strands agents running inside AgentCore.
from bedrock_agentcore import BedrockAgentCoreApp
from strands import Agent
from deepeval.integrations.agentcore import instrument_agentcore

instrument_agentcore()

app = BedrockAgentCoreApp()
agent = Agent(model="amazon.nova-lite-v1:0")

@app.entrypoint
def invoke(payload, context):
    return {"result": str(agent(payload.get("prompt")))}
See the AgentCore integration for the full surface (including Strands-specific spans).
Call instrument_strands() before creating or invoking your Strands agent. Use this when you run Strands directly (scripts, services, notebooks); if your outer boundary is the AgentCore app entrypoint, use the AgentCore tab instead.
from strands import Agent
from strands.models.openai import OpenAIModel

from deepeval.integrations.strands import instrument_strands

instrument_strands()

agent = Agent(
    model=OpenAIModel(model_id="gpt-4o-mini"),
    system_prompt="You are a helpful assistant.",
)

agent("Help me return my order.")
See the Strands integration for the full surface.
Drop-in replace from anthropic import Anthropic with from deepeval.anthropic import Anthropic. Every messages.create(...) call becomes an LLM span automatically.
from deepeval.anthropic import Anthropic

client = Anthropic()
client.messages.create(
    model="claude-sonnet-4-5",
    max_tokens=1024,
    messages=[{"role": "user", "content": "Hello"}],
)
See the Anthropic integration for the full surface (including async, streaming, and tool-use).
Register deepeval's event handler against LlamaIndex's instrumentation dispatcher.
import asyncio
from llama_index.llms.openai import OpenAI
from llama_index.core.agent import FunctionAgent
import llama_index.core.instrumentation as instrument

from deepeval.integrations.llama_index import instrument_llama_index

instrument_llama_index(instrument.get_dispatcher())

def multiply(a: float, b: float) -> float:
    return a * b

agent = FunctionAgent(
    tools=[multiply],
    llm=OpenAI(model="gpt-4o-mini"),
    system_prompt="You are a helpful calculator.",
)

asyncio.run(agent.run("What is 8 multiplied by 6?"))
See the LlamaIndex integration for the full surface.
Register DeepEvalTracingProcessor once, then build your agent with deepeval's Agent and function_tool shims.
from agents import Runner, add_trace_processor
from deepeval.openai_agents import Agent, DeepEvalTracingProcessor, function_tool

add_trace_processor(DeepEvalTracingProcessor())

@function_tool
def get_weather(city: str) -> str:
    return f"It's always sunny in {city}!"

agent = Agent(
    name="weather_agent",
    instructions="Answer weather questions concisely.",
    tools=[get_weather],
)

Runner.run_sync(agent, "What's the weather in Paris?")
See the OpenAI Agents integration for the full surface.
Call instrument_google_adk() once before building your LlmAgent.
import asyncio
from google.adk.agents import LlmAgent
from google.adk.runners import InMemoryRunner
from google.genai import types

from deepeval.integrations.google_adk import instrument_google_adk

instrument_google_adk()

agent = LlmAgent(model="gemini-2.0-flash", name="assistant", instruction="Be concise.")
runner = InMemoryRunner(agent=agent, app_name="deepeval-quickstart")
See the Google ADK integration for the full surface.
Call instrument_crewai() once, then build your crew with deepeval's Crew, Agent, and @tool shims.
from crewai import Task
from deepeval.integrations.crewai import instrument_crewai, Crew, Agent

instrument_crewai()

coder = Agent(
    role="Consultant",
    goal="Write a clear, concise explanation.",
    backstory="An expert consultant with a keen eye for software trends.",
)

task = Task(
    description="Explain the latest trends in AI.",
    agent=coder,
    expected_output="A clear and concise explanation.",
)

crew = Crew(agents=[coder], tasks=[task])
crew.kickoff()
See the CrewAI integration for the full surface.
🎉🥳 Congratulations! Calling your instrumented app now produces a trace. The rest of this page covers what to do with it — attaching test cases, classifying spans by type, and adding metadata.
Set test cases on traces and spans
This is the most important concept on this page: traces and spans both map to LLMTestCases, just at different scopes.
- Trace = end-to-end
LLMTestCase— what the user asked, what your app finally answered, what context was retrieved overall, what tools ended up being called. Used for end-to-end evals. Set withupdate_current_trace. - Span = component-level
LLMTestCase— the same parameters, but scoped to what happened inside that one component (a retriever, a tool, a single LLM call). Used for component-level evals. Set withupdate_current_span.
Both functions accept the same LLMTestCase parameters, and both can be called from anywhere inside your @observe'd code. A typical pattern is to set span-level test cases inside the components you want to grade individually, and let trace-level data accumulate from those same spans:
from openai import OpenAI
from deepeval.tracing import observe, update_current_trace, update_current_span

@observe()
def retriever(query: str) -> list[str]:
    chunks = ["List", "of", "text", "chunks"]
    update_current_span(input=query, retrieval_context=chunks)   # span test case
    update_current_trace(retrieval_context=chunks)               # contributes to trace test case
    return chunks

@observe()
def llm_app(query: str) -> str:
    chunks = retriever(query)
    res = OpenAI().chat.completions.create(
        model="gpt-4o", messages=[{"role": "user", "content": f"{query}\n\n{chunks}"}],
    ).choices[0].message.content

    update_current_span(input=query, output=res)       # span test case
    update_current_trace(input=query, output=res)      # finishes trace test case
    return res
You can call either function multiple times from different spans — values are merged across calls, with later calls overriding earlier ones.
This is what lets the trace-level test case build up incrementally as data flows through your app: a retriever span contributes retrieval_context, a generator span contributes output, and you end up with a complete LLMTestCase on the trace by the time the run finishes.
Map test case parameters to traces and spans
Both update_current_trace and update_current_span accept the same set of LLMTestCase parameters, fanned out as keyword arguments. The names line up one-to-one with LLMTestCase — the only one that's been renamed is actual_output, which becomes plain output on a trace/span (it's still the same field, just shorter):
LLMTestCase parameter | update_current_trace / update_current_span |
|---|---|
input | input |
actual_output | output |
expected_output | expected_output |
retrieval_context | retrieval_context |
context | context |
tools_called | tools_called |
expected_tools | expected_tools |
tags | tags (trace only) |
metadata | metadata |
Prettifying traces for coding agents
Traces aren't only read by humans. When you run evals locally and a metric fails, the failing trace is also what coding agents like Claude Code, Codex, and Cursor load into context to figure out which prompt, retriever, or tool actually caused the regression.
The more self-describing the trace tree is, the less the agent has to guess from function names — and the faster it can propose a real fix instead of a generic one.
Trace name
By default, a trace has no name. Set one at runtime with update_current_trace(name=...) so the failing run reads as "Customer support flow failed at retriever" rather than "llm_app failed at retrieve":
from deepeval.tracing import observe, update_current_trace

@observe()
def llm_app(query: str):
    update_current_trace(name="Customer support flow")
    # ...
Span names default to the function name they decorate, which is usually descriptive enough — but you can override with update_current_span(name=...) whenever the function name doesn't reflect what the span actually does.
Span types
The type parameter on @observe is a label, not an eval input. It does not affect scoring — metrics only care about the scope of the span. What it does is turn the trace tree from a generic call graph into a typed one, so a coding agent reading "this retriever span returned 0 chunks for input X" gets there immediately without having to infer roles from function names.
There are four built-in types plus a custom fallback. Each type accepts a few type-specific kwargs:
type | Purpose | Type-specific kwargs |
|---|---|---|
"llm" | A call to a language model | model, cost_per_input_token, cost_per_output_token (decorator); input_token_count, output_token_count via update_llm_span |
"retriever" | Fetches chunks from a vector store | embedder (decorator); top_k, chunk_size via update_retriever_span |
"tool" | A function the LLM/agent invokes | description |
"agent" | An autonomous decision-making step | available_tools, handoff_agents |
| anything else (default) | Custom — grouping or general-purpose | — |
from deepeval.tracing import observe

@observe(type="retriever", embedder="text-embedding-3-small")
def retrieve(query: str) -> list[str]: ...

@observe(type="llm", model="gpt-4o")
def generate(prompt: str) -> str: ...

@observe(type="tool", description="Search the web for a query.")
def web_search(query: str) -> str: ...

@observe(type="agent", available_tools=["search", "calculator"])
def supervisor_agent(query: str) -> str: ...Reference goldens at runtime
In deepeval, a golden is the reference test case used by your metrics, for example, to compare actual and expected outputs. During evaluation, you can read the active golden and pass its expected_output to spans or traces:
from deepeval.dataset import get_current_golden
from deepeval.tracing import observe, update_current_span, update_current_trace

@observe()
def tool(input: str):
    result = ...  # produce your model or tool output

    golden = get_current_golden()                  # active golden for this test
    expected = golden.expected_output if golden else None

    # set on the span (component-level)
    update_current_span(input=input, output=result, expected_output=expected)

    # or set on the trace (end-to-end)
    update_current_trace(input=input, output=result, expected_output=expected)
    return result
If you don't want to use the dataset's expected_output, pass your own string instead.
Environment Variables
If you run your @observe decorated LLM application outside of evaluate() or assert_test(), you'll notice some logs appearing in your console. To disable them completely, just set the following environment variables:
CONFIDENT_TRACE_VERBOSE=0
CONFIDENT_TRACE_FLUSH=0
Visualize and Monitor on Confident AI
Everything above runs entirely locally — you don't need an account for any of it. But once your traces start carrying real data (test cases, span types, tags, metadata, token costs), reading them in a terminal stops scaling.
Confident AI is the official platform for deepeval and renders the exact same trace data you're already producing into a UI:
You get this with zero additional code — just log in:
deepeval loginOnce logged in, the same @observe-decorated app will also stream traces in real-time, let you run online evaluations on production traffic, log prompt versions on LLM spans, and visualize token costs across runs.
Next Steps
Now that you have your traces, you can run either end-to-end or component-level evals.
End-to-End Evals
Learn how to run end-to-end evals with your trace data.
Component-Level Evals
Learn how to run component-level evals using tracing.
FAQs
What is tracing and why would I use it for evals?
How much code does it take to set up tracing?
@observe decorator per component. You add metrics and a test case with update_current_span() inside the function, and deepeval handles the rest.Do I have to use @observe, or does tracing work with my framework automatically?
@observe instrumentation, deepeval ships native integrations for LangChain, LangGraph, LlamaIndex, Pydantic AI, CrewAI, and more that auto-trace the spans your framework emits — typically just one setup call.Does tracing run my metrics in production?
@observe-decorated app outside of evaluate() or assert_test(), metrics don't run. You can silence local trace logs with CONFIDENT_TRACE_VERBOSE=0 and CONFIDENT_TRACE_FLUSH=0.Do I need an account to use tracing?
Can my team visualize traces in a UI, keep them on the cloud, and monitor production?
deepeval) renders the exact same trace data into a UI with zero extra code — your team gets a shared cloud view, real-time production traces, online evals, and token cost tracking. It's optional and local tracing works the same without it.